


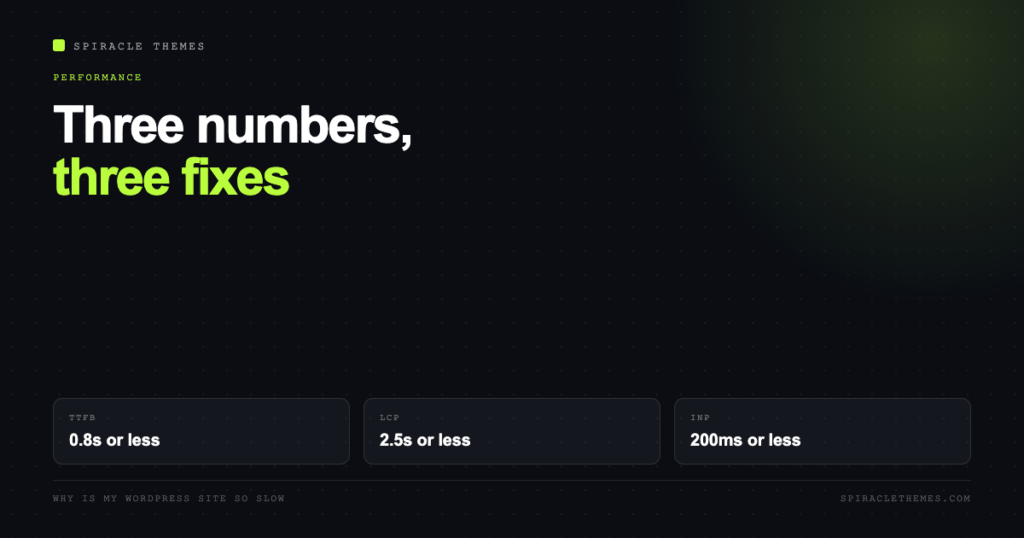
“My WordPress site is slow” is three different complaints wearing one sentence, and they have three different fixes. A site that waits two seconds for the server to answer needs hosting or caching work. A site that answers in 200 milliseconds and then loads a 4MB hero image needs image work. A site that jumps around while loading needs layout work. Doing them in the wrong order is why people install five caching plugins and stay slow.
The fix is to measure first, then work on the thing that is actually failing.
Start with three numbers
Google’s Core Web Vitals give you the target, and Time to First Byte tells you whether the problem is the server or the page. Both come from Google’s own documentation, not from a plugin’s dashboard score.
| Number | Good | What a bad score means |
|---|---|---|
| Time to first byte (TTFB) | 0.8 seconds or less; poor above 1.8s | Server, PHP, database or cache. No image work will help. |
| Largest Contentful Paint (LCP) | 2.5 seconds or less | The main content is slow to arrive: hero image, fonts, render-blocking CSS. |
| Interaction to Next Paint (INP) | 200 milliseconds or less | Too much JavaScript, usually from plugins and third-party tags. |
| Cumulative Layout Shift (CLS) | 0.1 or less | Content moves after paint: unsized images, late CSS, injected banners. |
One nuance worth knowing before you chase all four: TTFB is not itself a Core Web Vital. web.dev describes the thresholds as a rough guide, because a fast server does not guarantee a fast page and a slightly slow server does not automatically fail you. Use it as a diagnostic, not a grade.
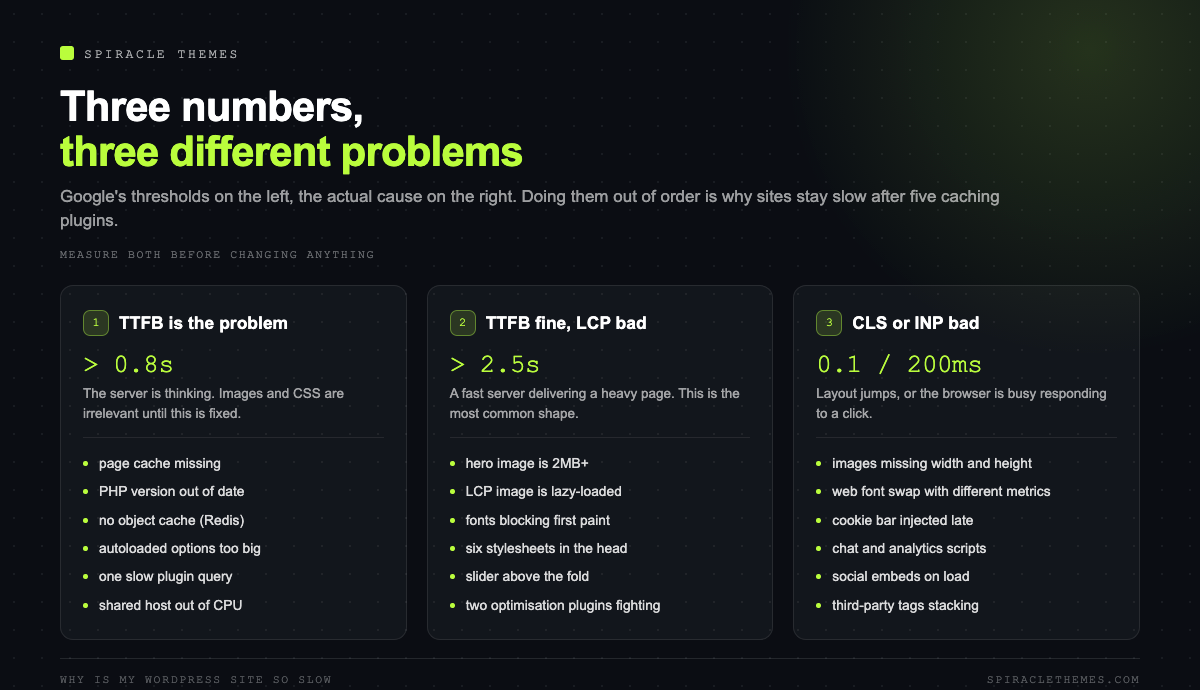
If TTFB is bad, the problem is not your theme
High TTFB means the server is thinking. In WordPress, the usual suspects, roughly in order of how often they are the answer:
- No page cache. Every visitor triggers PHP and a pile of database queries. A page cache turns that into a file read. If your host does not provide one, this is the first thing to fix.
- An old PHP version. Each PHP major release brings performance work, and old versions are slower as well as unsupported. PHP 8.1 and earlier stopped getting security fixes on 31 December 2025, and 8.3 has been security-only since then, so if the host is still on 8.1 you have both a speed and a security problem.
- No object cache. On a busy site, options and transients are read from the database on every request. A persistent object cache (Redis or Memcached) removes most of that.
- A bloated options table. Autoloaded options load on every single request. Plugins that leave rows behind quietly make every page slower.
- Slow queries from one plugin. A plugin that queries on every page load, usually a related-posts or analytics plugin, can dominate the profile.
- A cheap shared host with crowded neighbours. No amount of tuning fixes a server that is out of CPU.
If TTFB is fine but LCP is not, the page is heavy
This is the most common shape of the problem: a fast server delivering a slow page. The culprits are consistent.
The hero image is doing the damage
A full-width hero at 3000 pixels wide, saved as a JPEG at 90 quality, is often 1.5 to 3MB. It is also usually the LCP element, so it directly sets your score. Resize it to the largest size it is actually displayed at, export as WebP or AVIF, and serve responsive sizes so phones do not download a desktop asset. web.dev’s guidance is blunt about this: prefer WebP or AVIF over older raster formats, because they are usually far smaller.
One specific mistake to check: make sure the LCP image is not lazy-loaded. Lazy loading defers images until they are needed, which is right for images below the fold and exactly wrong for the one the visitor is waiting to see.
Fonts and render-blocking assets
Every font file is a request the browser must make before text renders. Host fonts locally instead of calling a third party, load only the weights and subsets you use, and preload the one file used above the fold. Then check the head of the document: a theme that enqueues six stylesheets and four scripts in the head blocks the first paint while they download.
Sliders, page builders and “optimisation” stacks
A slider is one of the most expensive things you can put above the fold: multiple large images, a JavaScript library, and a layout shift risk. Page builders add their own CSS and JavaScript to every page whether that page uses the element or not. And stacking two or three optimisation plugins is worse than one, because they fight over minification and critical CSS and occasionally break each other’s output.
If CLS is bad, reserve the space
Layout shift is almost always one of four things: images without width and height attributes, a web font swapping in with different metrics, a banner or cookie bar injected above the content, or an ad slot with no reserved height. Fix them by declaring size in the markup: width and height on images, a fixed-height container for ads and banners, and a font strategy that avoids a late swap of a very different typeface.
If INP is bad, count the scripts
Interaction to Next Paint measures how long the browser takes to respond when someone clicks or taps. A poor INP means the main thread is busy. The usual cause is not your theme’s own JavaScript, it is the accumulated weight of analytics, chat widgets, heatmaps, popups, A/B testing tools and social embeds. Each one is small in isolation and significant together.
Practical order: remove what you do not use, defer what you keep, and load chat widgets on interaction instead of on page load.
The 20-minute triage anyone can run
- Run the homepage and one template that matters (a product page, a long post) through PageSpeed Insights, and note which of the four numbers fails.
- If TTFB is over 0.8s on a cached page, stop: this is hosting, PHP or cache, and the rest can wait.
- Check the PHP version in Tools, Site Health, Info. Move it to a supported version on staging first.
- Open the network panel, reload, sort by size. The top three requests are usually your answer.
- Disable plugins in groups on staging and re-measure. Do not do this on live.
- Check one product page and one archive page, not just the homepage. Homepages are often the fastest page on the site and the least representative.
Caching, layer by layer
“Caching” is four different things and knowing which one is missing saves a week:
| Layer | What it removes | Typical owner |
|---|---|---|
| Browser cache | Repeat downloads of CSS, JS and images | Headers, usually set by host or plugin |
| Page cache | PHP execution and database queries per visit | Host, or a caching plugin |
| Object cache | Repeated database reads of options and queries | Host, via Redis or Memcached |
| CDN | Distance between visitor and server | Host or a CDN provider |
If a site has a CDN and no page cache, it is optimising delivery of a page that is expensive to build. Fix the build first.
When the honest answer is a rebuild
There is a point where tuning stops paying. Signs you are there:
- A page builder is loading 40 scripts to render three sections, and the site only needs three sections.
- The theme is abandoned, and each PHP release brings another round of warnings and broken features.
- Every plugin added in the last two years was added to work around a limitation of the build.
- You cannot get LCP under 4 seconds even with a page cache, optimised images and a CDN.
A rebuild is not automatically faster, of course. A badly built new site is just as slow, with newer dependencies. The point is that the fix becomes structural rather than incremental.
The database side nobody checks
Server-side slowness often starts in the database, and it accumulates quietly. Four things to look at in phpMyAdmin or through a plugin:
- Autoloaded options. These load on every request, cached or not. A single plugin can add hundreds of kilobytes, and old plugins leave their rows behind after removal. Compare your autoloaded total against a fresh install and treat a large gap as a finding.
- Post revisions. Useful during editing, useless after publication. A site with 300 posts can carry thousands of revision rows.
- Expired transients. Some plugins write options that never expire and never get cleaned, because their cleanup runs on a schedule that no longer fires.
- Orphaned meta. Rows left by deleted plugins and deleted posts, which slow down queries that join meta tables.
A cleanup does not need to be aggressive. Revisions, transients and orphans are safe to remove; anything else deserves a backup first.
Hosting tiers, in practical terms
Hosting is where the money question actually lives, because it sets the floor on TTFB:
| Type | What you get | Ceiling |
|---|---|---|
| Cheap shared hosting | Fine for a brochure site with light traffic | Neighbours, no staging, PHP version often old |
| Managed WordPress | Server-side page cache, staging, backups, curated PHP | Cost per site, and limits on what you can install |
| VPS or cloud | Control, dedicated resources, Redis, CDN | You are the sysadmin, including the 2am part |
| Headless with a static front end | Fast delivery for content-heavy sites | Complexity, and re-render latency on publish |
If the site is a shop with campaigns and a checkout, the middle row is usually the right buy. If it is a brochure site that gets 500 visits a month, the top row is fine and paying four times more buys nothing.
How to tell whether a fix worked
Most speed work is judged by the wrong measurement: a single lab run, taken once, on a laptop, on a fast connection. Three habits make the result trustworthy:
- Use field data where you can. PageSpeed Insights reports both lab and field data; the field numbers are what real visitors experienced over the last 28 days, and they are the ones Google uses.
- Judge the 75th percentile, not the mean. Core Web Vitals are assessed at the 75th percentile of page loads, so a good average with a bad tail is still a failing site.
- Change one thing, then re-measure three times. Cache state, third-party latency and CDN edge make single runs noisy. If three runs disagree, the fix is not the reason for the difference.
Take a baseline screenshot of the numbers before you start. Six weeks later, memory is unreliable and the only honest comparison is the one in the file.
FAQ
Why is my WordPress site slow only sometimes?
Usually cache misses, or a shared server under load at peak times. A first-visit request that takes 3 seconds and a cached one that takes 200 milliseconds produce exactly that pattern.
Do caching plugins make a site faster?
They remove work per request, which helps a server-bound site. They do nothing for a heavy page, and stacked plugins can add overhead and break layouts.
Is WordPress itself slow?
No. A clean WordPress install with a cache answers in tens of milliseconds. Slow WordPress sites are almost always slow hosting, an old PHP version, or an accumulation of plugins and unoptimised images.
How many plugins is too many?
The count is not the metric; the weight is. Fifteen well-built plugins can be lighter than four bad ones. Measure the page, not the plugin list.
Will fixing speed improve my rankings?
Page experience is a real but modest ranking input. Speed reliably improves conversion and engagement, which is the larger and more certain win.
If the site is not slow but unreliable, the diagnosis is different: what monthly maintenance actually covers.